Mean, Median, Mode: The Three Musketeers of Misleading Stats
4 min read • April 18, 2025
#statistics #data literacy #data science #analytics
Ever heard the joke about the statistician who drowned in a river with an average depth of three feet? It’s not just a joke, it’s a perfect example of how averages can deceive us. Let’s wade into the murky waters of statistics and learn how to stay afloat.
1. Mean: The people’s favorite (can sometime mislead too!)
The mean is like that friend who insists everyone split the bill equally, even when one person ordered the most expensive wine and the rest had salads.
e.g: The Silicon Valley Salary Trap
Imagine a startup with 5 employees
| Role | Salary |
|---|---|
| Junior Dev | $60,000 |
| Junior Dev | $65,000 |
| Senior Dev | $120,000 |
| Designer | $80,000 |
| CEO | $800,000 |
Mean Salary: $225,000
”We offer competitive salaries averaging $225K!” they boast. Technically true - practically misleading.
💡 Reality Check: Remove the CEO, and the average drops to $81,250 (much closer to reality)
2. Median: The Moderate Middle-Man
The median is like your neutral friend — avoids extremes but may miss the nuances.Very different distributions can share the same median
🏠 The Housing Market Illusion
Oakwood Heights:
$300K – $310K – $320K – $330K – $340K
Median: $320K
Riverside Mix:
$150K – $200K – $320K – $500K – $600K
Median: $320K
Same median, completely different housing realities.
3. Mode: The One-Hit Wonder
The mode is like the loudest voice in the room (not necessarily the most insightful - IYKYK)
👕 The T-Shirt Tale
Monthly sales at a clothing store:
| Size | Units Sold | Returns |
|---|---|---|
| S | 100 | 5 |
| M | 150 | 8 |
| L | 148 | 7 |
| XL | 95 | 4 |
| XXL | 45 | 15 |
Mode = Medium (most common size) — but context matters:
- Large is only 2 units behind
- XXL has the highest return rate
- Seasonality may affect sales
💡 Pro Tip: For categorical data, explore the full distribution — not just the top value.
Real-World Statistical Deceptions
💼 The Salary Game
Real-world income distributions are rarely normal (Source: Wikimedia Commons)
“The average salary in our industry is $120K!”
What they don’t tell you:
- 80% earn less than $100K
- A few CTOs skew the average
- Regional cost of living varies
- Stock options are excluded
📱 Social Media Metrics
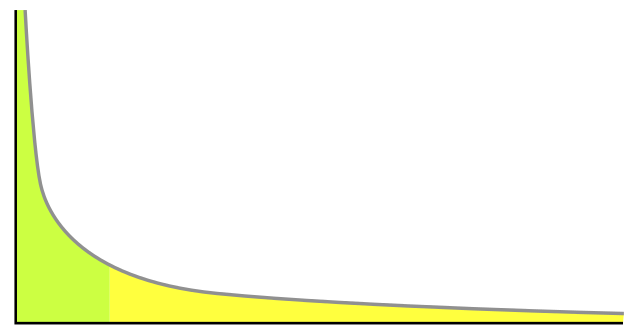
Social media engagement follows a “long tail” distribution (Source: Wikimedia Commons)
“Our posts average 10,000 engagements!”
But…
- Most posts have: 50-100 engagements
- Rare viral hits inflate the average
- Median: 75
- Mode: 32
How to Not Get Fooled: A Practical Guide
-
Ask the Right Questions
- What’s the distribution shape?
- Are there outliers?
- What’s omitted?
- Who benefits from this metric?
-
Use Multiple Metrics (also know when to use what)
| Metric | When to Use | Watch Out For |
|---|---|---|
| Mean | Normal distributions | Outliers |
| Median | Skewed data | Hidden spread |
| Mode | Categorical variables | Multiple peaks |
| Range | Overall spread | Extreme values |
| IQR | Robust spread measure | Complex distributions |
- Visualize Data (below are some tools)
- Histograms: Frequency
- Box plots: Spread & outliers
- Violin plots: Shape + spread
- Scatter plots: Relationships
TL;DR: Your Statistical Survival Kit
-
Never Trust a Lone Number
- Demand context
- Use multiple metrics
- Visualize the data
-
Context is Everything
- Time, population, and outliers matter
- Missing data? Red flag 🚩
📚 Want to Learn More?
- Recommended resources:
- Khan Academy: Statistics & Probability
- Seeing Theory (Brown University)
- Statistics by Jim
💬 Your Turn
Have you encountered misleading averages in the wild? Share your story in the comments and we can decode deception together.