Metrics that Matter: Beyond Accuracy
6 min read • July 21, 2025
#ML Metrics #Model Evaluation #Data Science #Responsible AI #Security
1. Why Metrics Decide Everything
A machine learning model is only as good as the metric you judge it by.
Pick the wrong metric, and you might celebrate success while your system quietly fails in the real world.
Example 1: Fraud Detection
- Accuracy = 99%.
- Prediction strategy = always say “not fraud”.
- Business outcome = every fraud case slips through, and the company bleeds money.
Example 2: Healthcare
- A cancer test with 92% accuracy sounds great.
- But if it misses 8% of patients (low recall), lives are at risk.
Metrics aren’t neutral numbers. They’re the lens that shapes decisions.
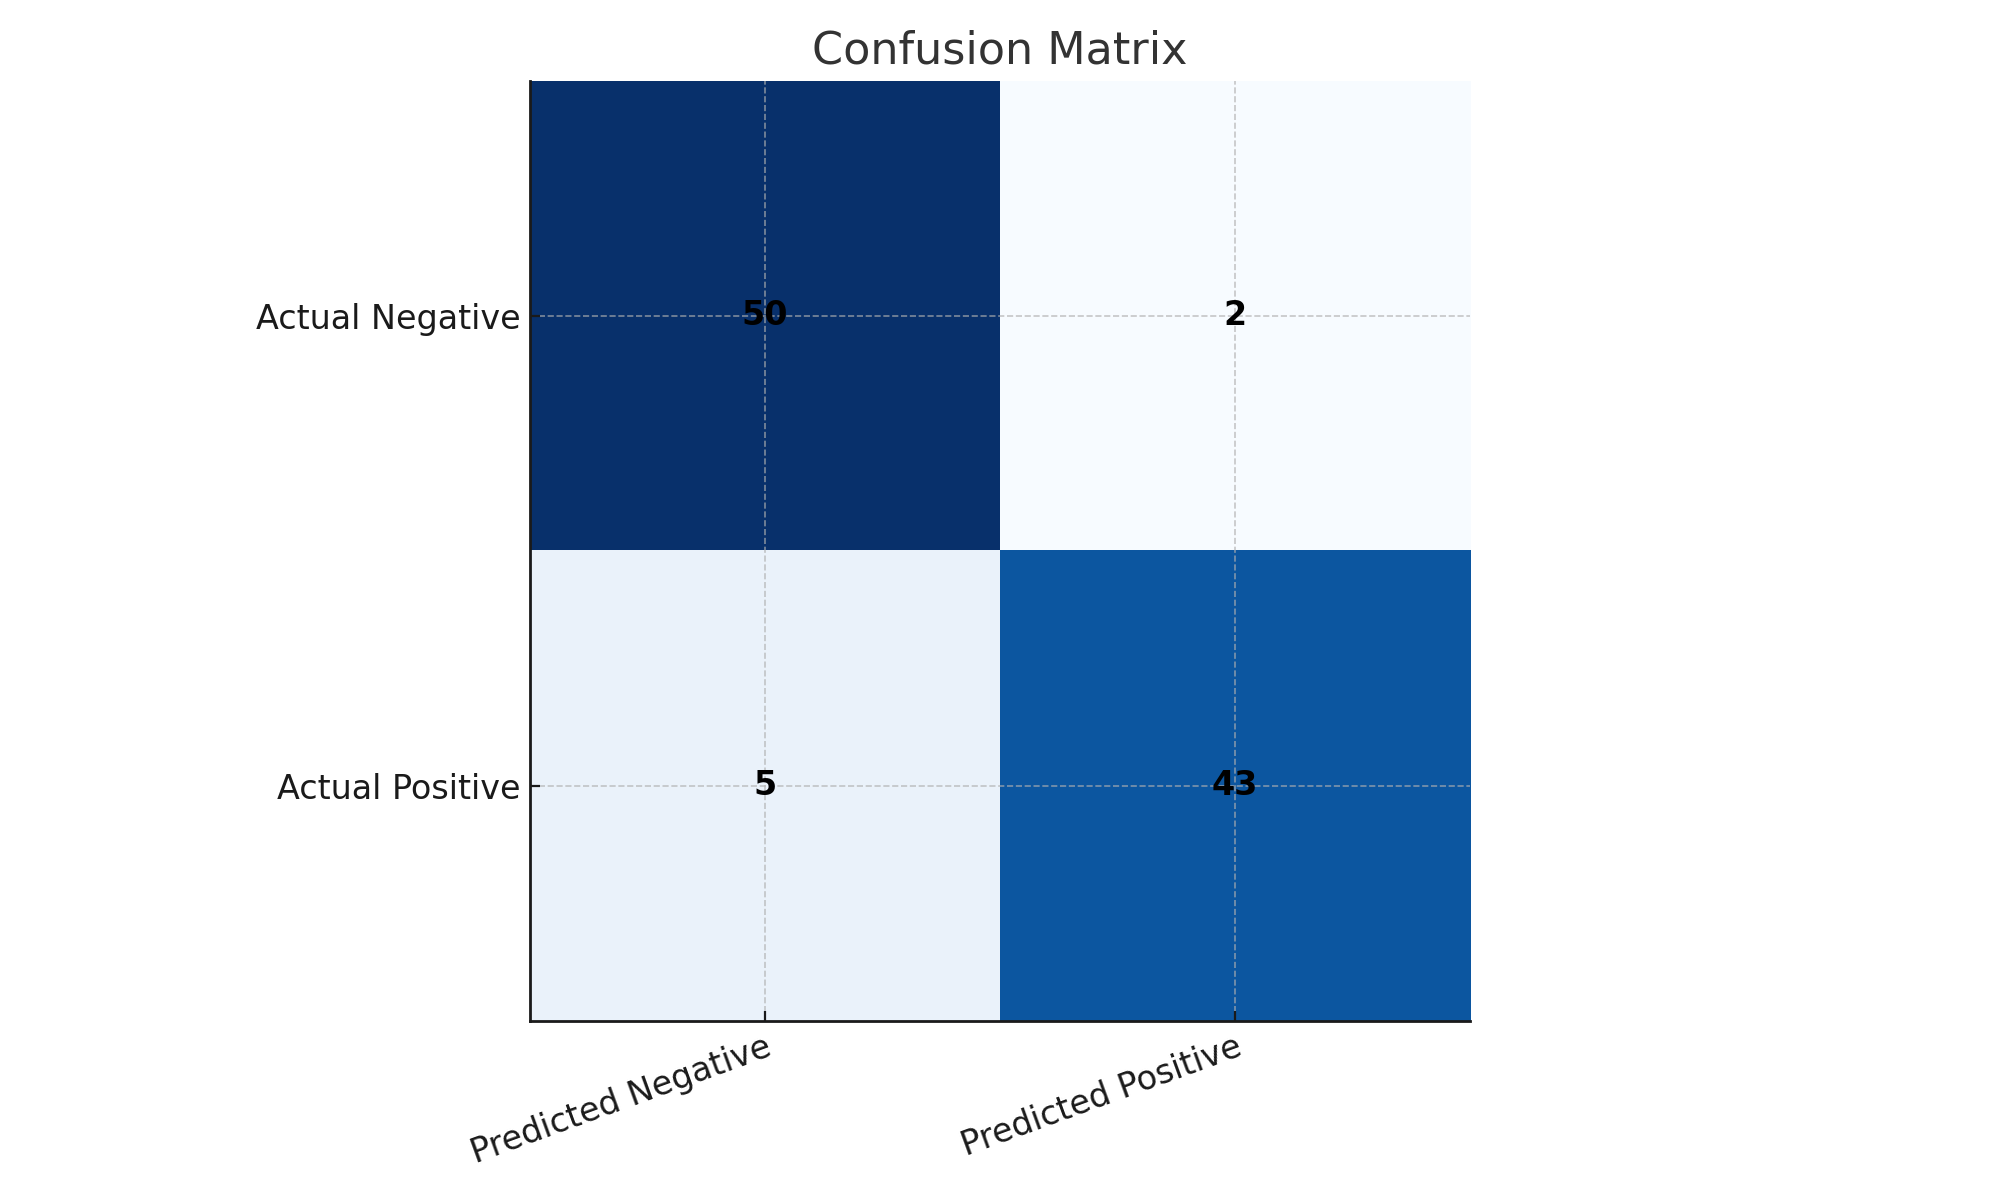
2. Classification Metrics
When outcomes are discrete (spam/not spam, fraud/not fraud, attack/not attack), these metrics dominate.
Accuracy
$$ Accuracy = \frac{TP + TN}{TP + TN + FP + FN} $$
✅ Works fine if classes are balanced.
❌ Misleading with imbalanced data (rare events).
Examples
- Rare disease detection → predicting “no disease” always gives 99% accuracy but misses every patient.
- Intrusion detection → 99% accuracy by labeling all traffic “safe” is useless.
Precision
$$ Precision = \frac{TP}{TP + FP} $$
Examples
- Spam filter → high precision means few legit emails wrongly flagged.
- Face unlock → high precision means fewer false unlocks (intruders getting in).
Recall (Sensitivity)
$$ Recall = \frac{TP}{TP + FN} $$
Examples
- Cancer screening → high recall means nearly all patients are detected.
- Intrusion detection → high recall ensures almost no attack slips past.
F1 Score
$$ F1 = 2 \times \frac{Precision \times Recall}{Precision + Recall} $$
Balances precision and recall.
Examples
- Fraud detection → balance needed: missing fraud (FN) costs money, false alarms (FP) frustrate customers.
- Hiring ML system → wrong balance could either ignore good applicants (low recall) or overwhelm HR with unqualified ones (low precision).
ROC & AUC
- ROC Curve = True Positive Rate vs False Positive Rate.
- AUC = probability the model ranks a random positive higher than a random negative.
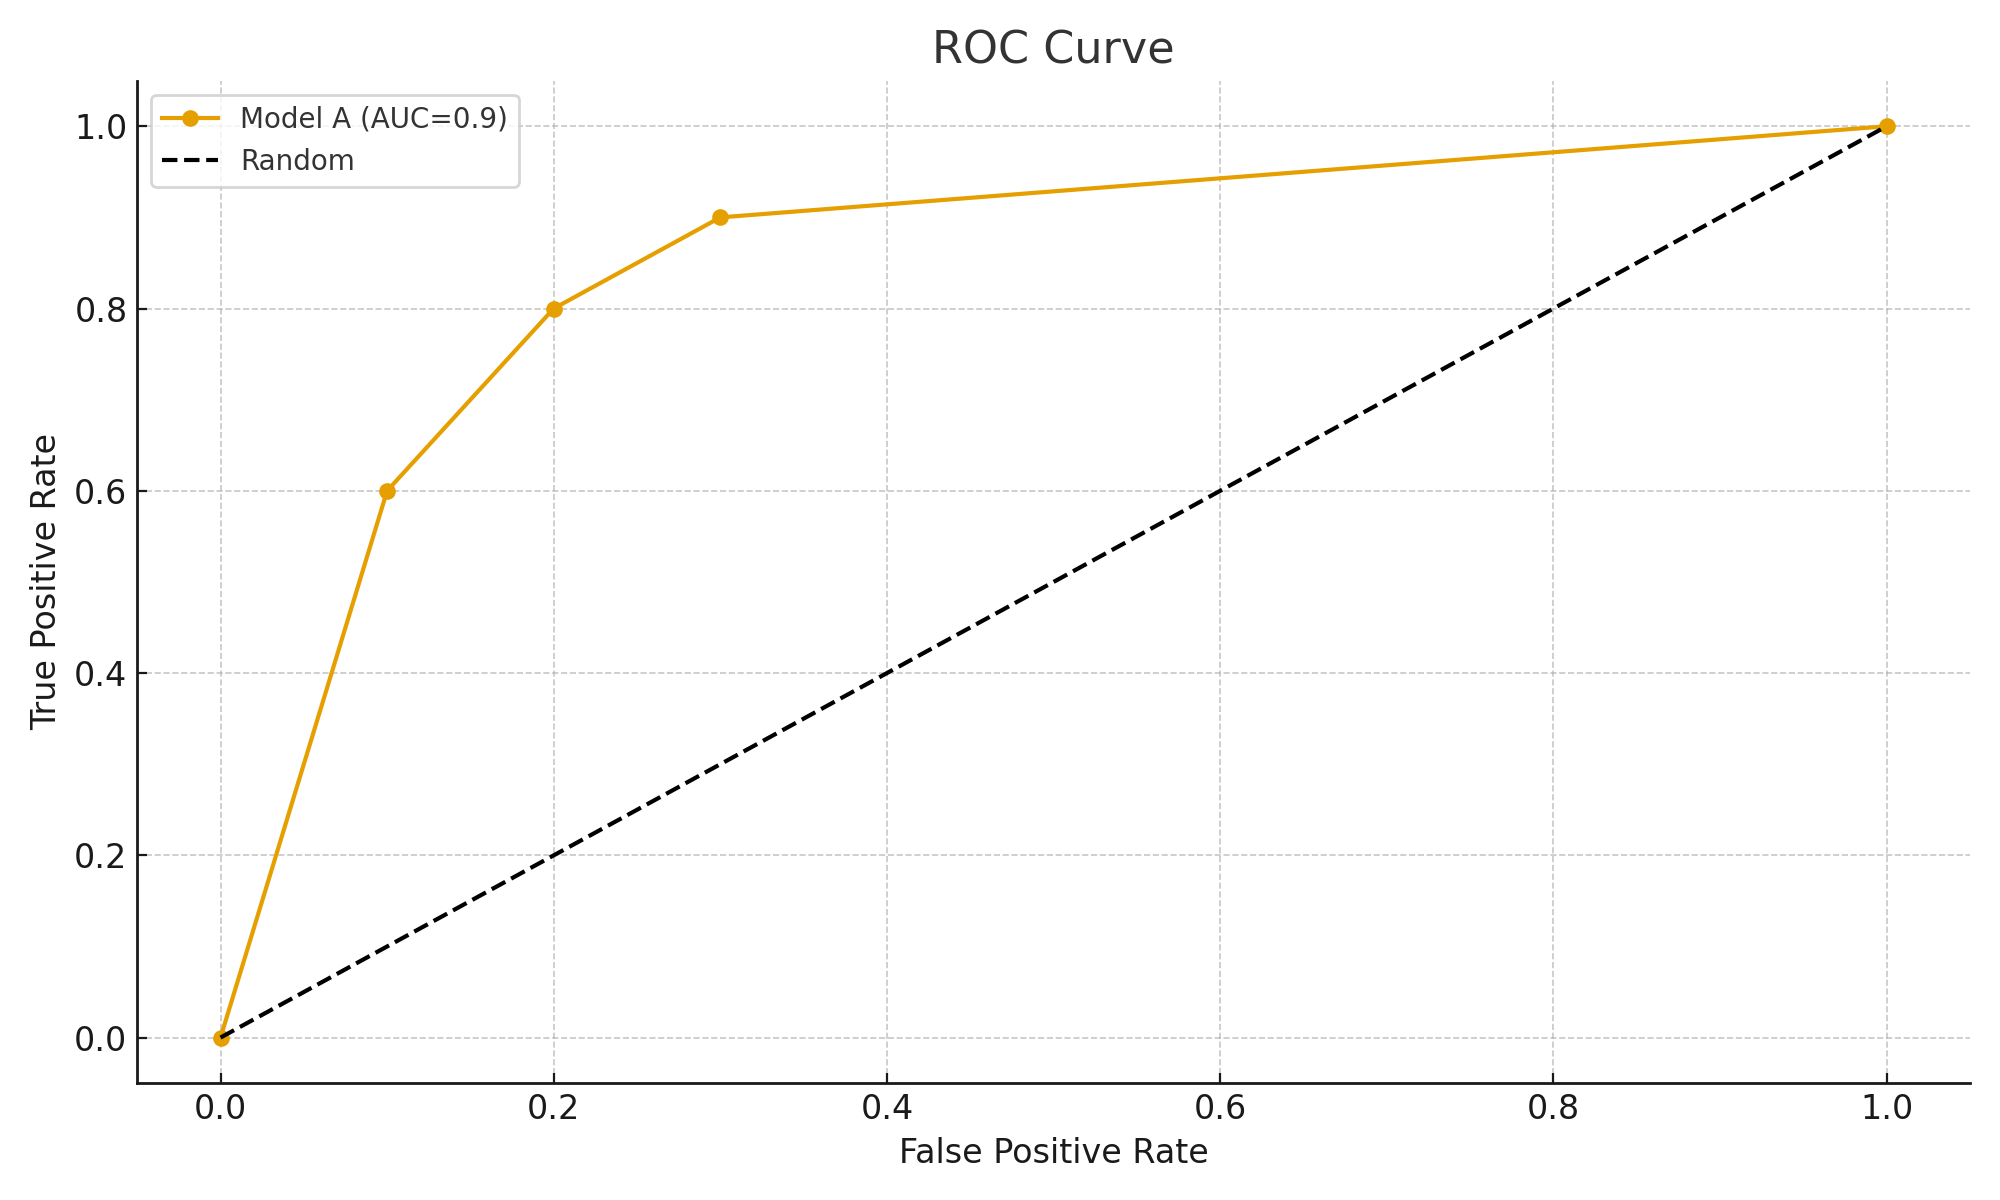
Examples
- Credit scoring → AUC = 0.85 → 85% chance a defaulter gets a lower score than a non-defaulter.
- Malware detection → high AUC means strong separation of malicious vs benign files.
Log Loss
$$ LogLoss = -\frac{1}{N}\sum \big[y \log(\hat{p}) + (1-y)\log(1-\hat{p})\big] $$
Examples
- Security system → predicting 0.99 safe but it’s actually malware = huge penalty.
- Weather forecast → “99% no rain” but it pours → heavy penalty, bad trust.
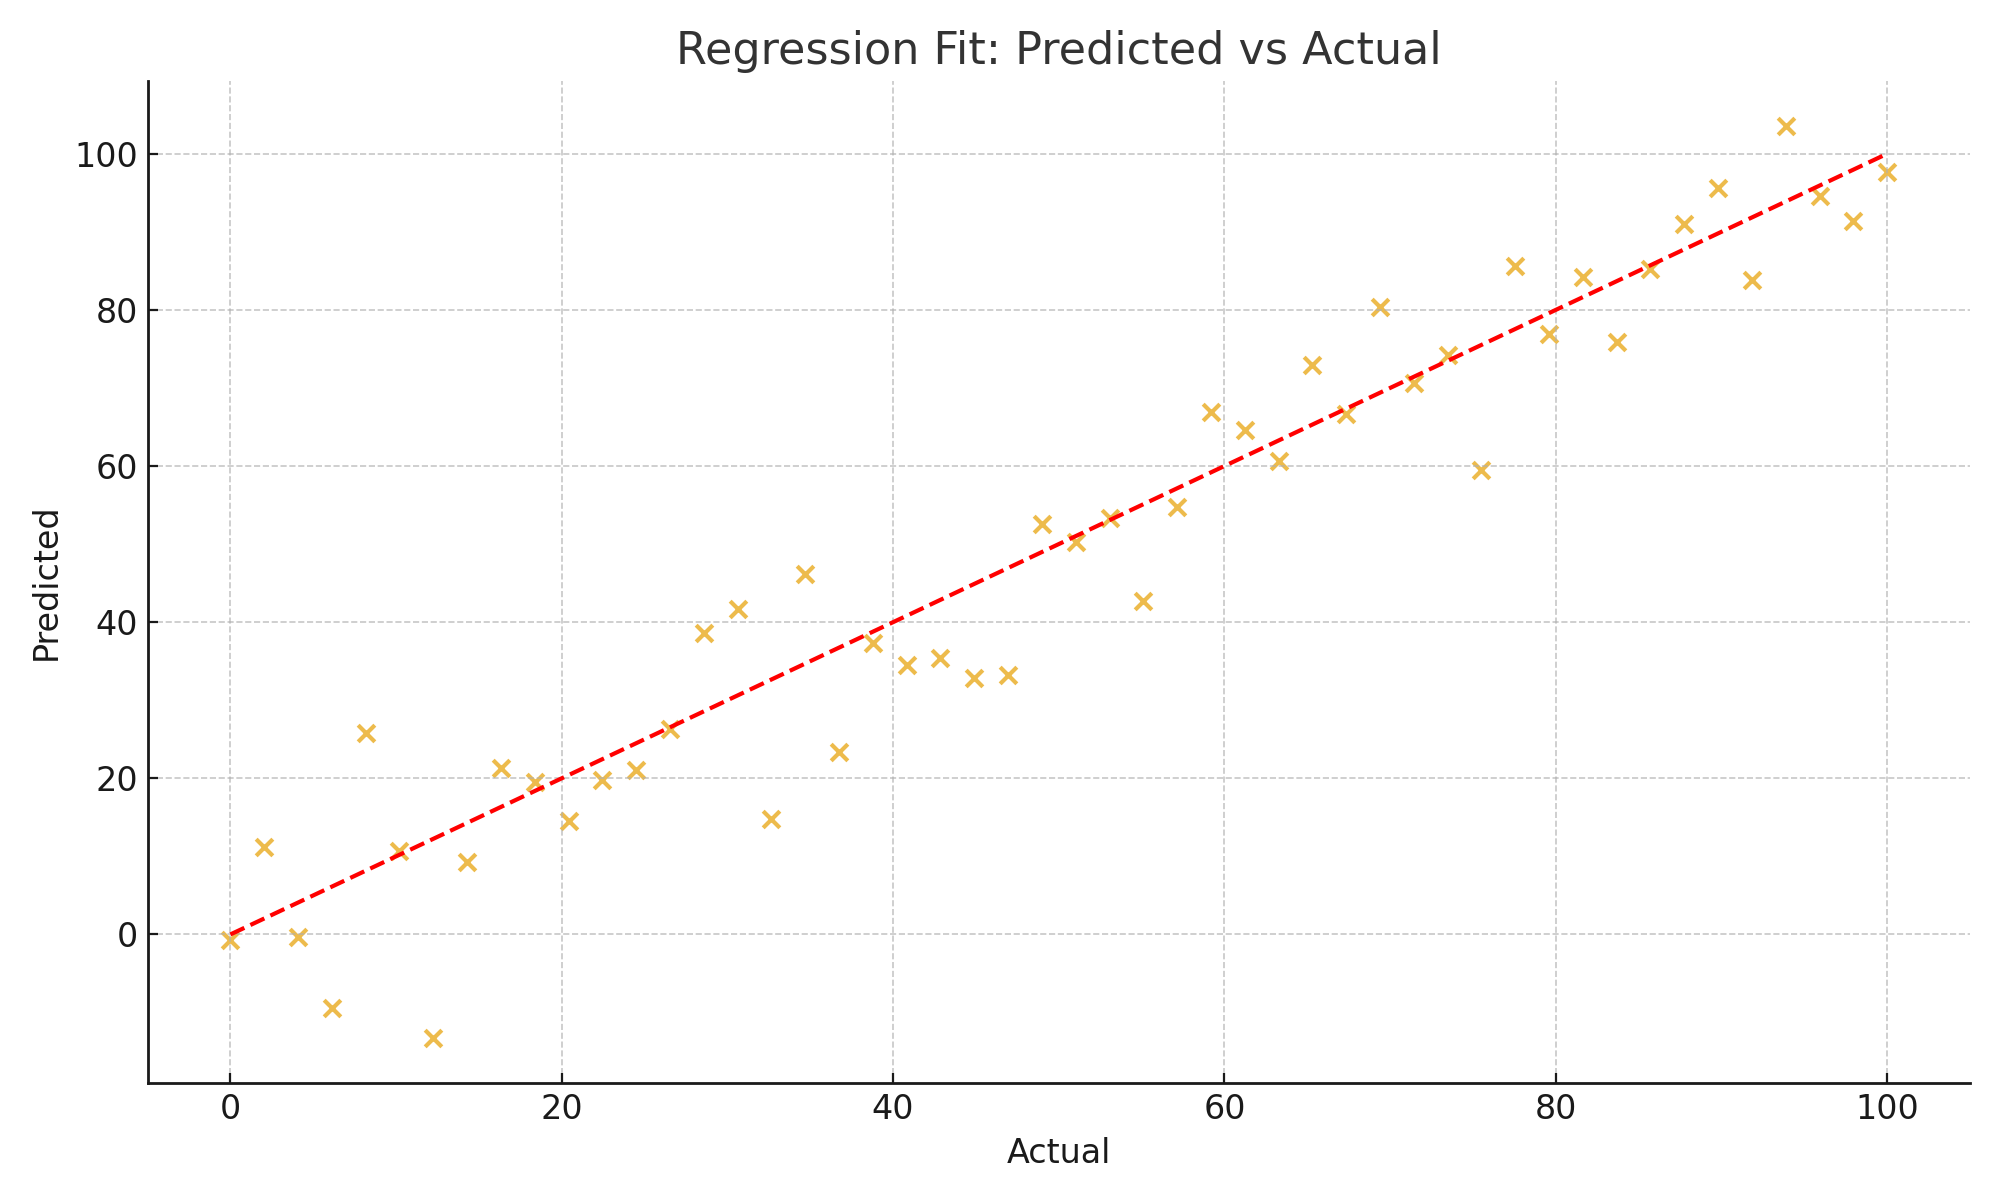
3. Regression Metrics
For continuous predictions (sales, prices, demand, ETAs).
MAE
$$ MAE = \frac{1}{n}\sum |y_i - \hat{y}_i| $$
Examples
- House price prediction → MAE = $15k.
- Ride-hailing ETAs → MAE = 2 minutes.
RMSE
$$ RMSE = \sqrt{\frac{1}{n}\sum (y_i - \hat{y}_i)^2} $$
Examples
- Weather forecasting → large errors punished.
- Demand forecasting → one big miss hurts RMSE heavily.
R²
$$ R^2 = 1 - \frac{SS_{res}}{SS_{tot}} $$
Example
- Sales prediction → R² = 0.7 means model explains 70% of variability.
MAPE
$$ MAPE = \frac{100}{n}\sum \left|\frac{y_i - \hat{y}_i}{y_i}\right| $$
Examples
- Retail sales → “10% error” easy for business to interpret.
- Problem: unstable with small denominators.
Quantile Loss
- Focuses on under/over-prediction.
Example
- Inventory planning → 90th percentile avoids costly stockouts.
4. Ranking & Recommendation Metrics
Precision@k / Recall@k
Examples
- Netflix → Precision@10 = how many of top 10 shows are actually watched.
- Security alerts → Recall@20 = how many real threats are caught in top 20.
NDCG
Examples
- Google Search → Wikipedia at #1 is more useful than at #10.
- Threat triage → most dangerous alerts should appear first.
5. Calibration & Reliability
Calibration Curve
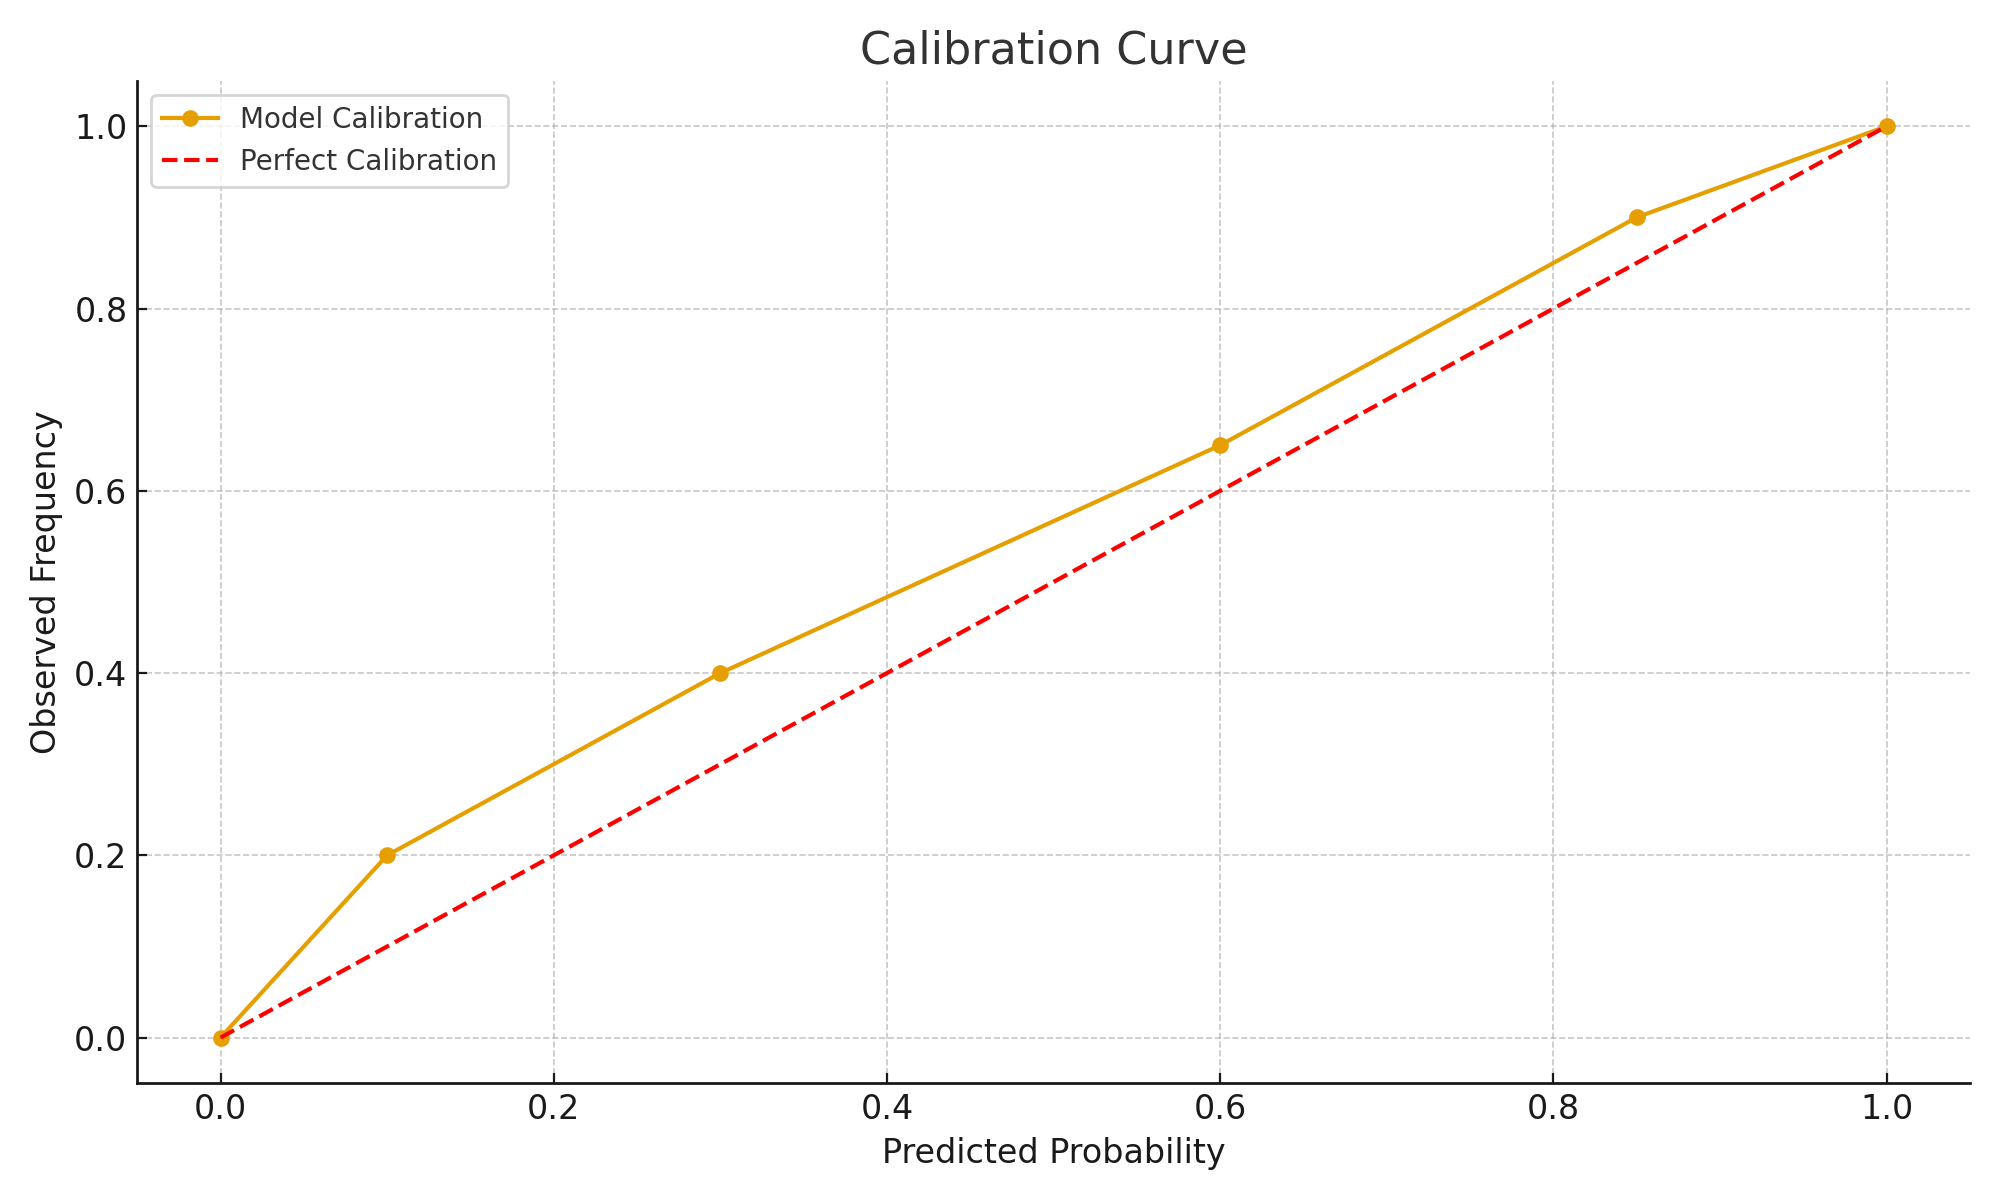
Examples
- Healthcare → “90% chance positive” should really mean 9/10 positive.
- Security → analysts need reliable probability estimates.
Brier Score
$$ Brier = \frac{1}{N}\sum (\hat{p} - y)^2 $$
Example
- Weather → “70% rain” should mean rain 7/10 times.
6. Fairness & Responsible Metrics
Equal Opportunity
- Example: Loan approvals → equally good at identifying creditworthy applicants across groups.
Demographic Parity
- Example: Hiring tool → avoids systematic demographic preference.
7. Security & Risk-Sensitive Cases
- Fraud detection → F1 or cost-sensitive metrics.
- Intrusion detection → recall matters more than precision.
- Healthcare diagnostics → recall high to avoid missed cases, precision good to avoid unnecessary panic.
8. Business Impact Layer
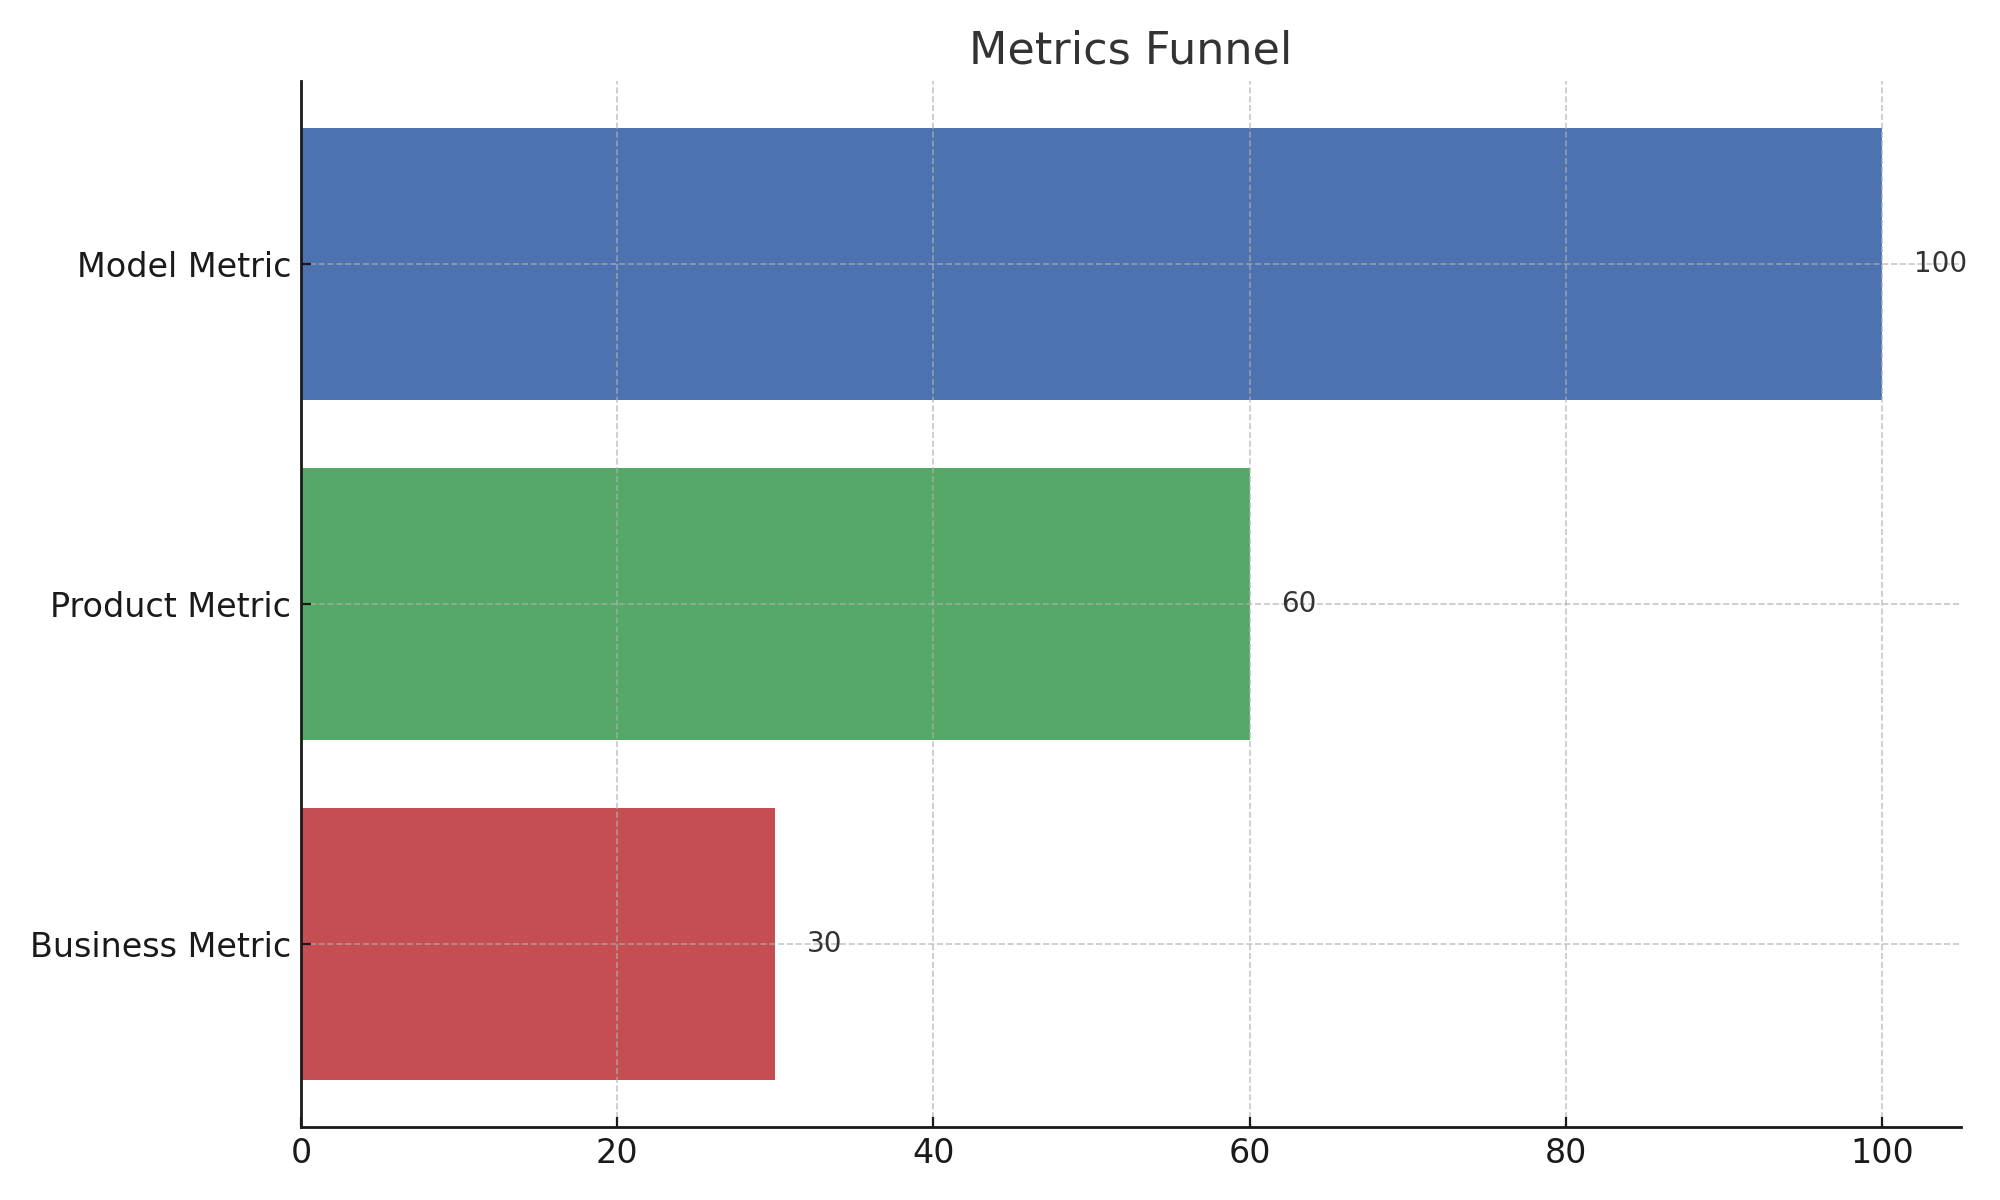
- Model metric: precision, recall, RMSE.
- Product metric: churn, CTR, conversion.
- Business metric: revenue, trust, growth.
Examples:
- Ads → CTR ≠ revenue.
- Social apps → DAU ≠ retention.
- Airbnb → nights booked = real North Star.
9. Pitfalls & Good Practices
- Vanity metrics: accuracy, DAU.
- Thresholds matter: ROC ≠ decision cost.
- Metric gaming: optimize the number, lose the goal.
10. How to Choose the Right Metric
Checklist for a good metric:
- Aligned with real objectives.
- Sensitive to change.
- Robust to imbalance & manipulation.
- Communicable to non-tech.
- Actionable.
11. Quick Reference Table
| Model Type | Use Cases | Best Metrics | Why |
|---|---|---|---|
| Classification | Spam, fraud, medical | Precision, Recall, F1, AUC | Balances false alarms vs misses; AUC for ranking. |
| Regression | Prices, demand, ETAs | MAE, RMSE, R², MAPE | MAE interpretable, RMSE punishes big misses, R² for variance. |
| Ranking/Recsys | Search, alerts, recommendations | Precision@k, Recall@k, NDCG | Quality of top-k results matters most. |
| Risk/Probability | Credit scoring, fraud, healthcare | Log Loss, Calibration, Brier | Reliable probabilities matter. |
| Fairness | Hiring, lending | Equal Opportunity, Demographic Parity | Ensures equitable treatment. |
| Security/Anomaly | Intrusion detection, malware | Recall, F1, Cost-sensitive | Missing one threat costs more than false alarms. |
Closing Thought
Metrics are not just numbers. They are compasses.
Choose the wrong one, and your model navigates confidently in the wrong direction — costing money, trust, or even lives.
Choose the right one, and metrics become what they should be:
the bridge between data, models, and impact.